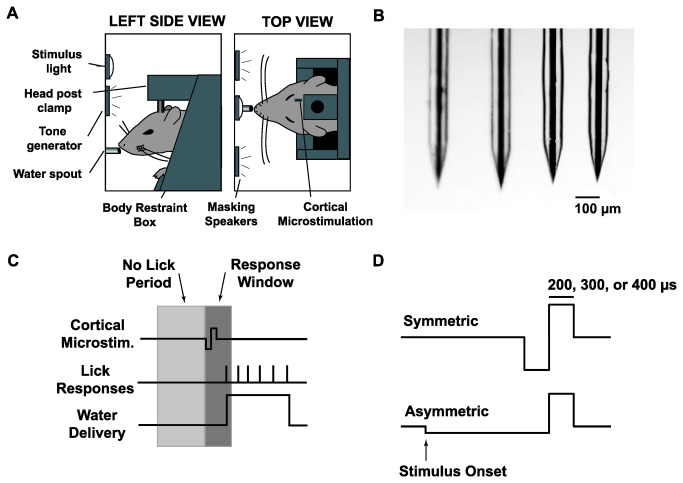
Figure 1. Overview of Go/No-Go Behavioral Detection Task.
A: Diagram of the behavioral apparatus. Head-fixed animals were placed in a light and sound attenuating chamber and trained to respond to cortical microstimulation by licking a water spout.
B: Photomicrograph of microelectrode array showing four microelectrodes.
C: Timeline of the behavioral task. Following the beginning of a trial, cortical microstimulation was presented at a random time drawn from a uniform distribution of 2-8s. To discourage random guessing, a minimum 1s “no lick” period was imposed such that any licks in the 1s preceding stimulus delivery delayed the stimulus onset. Animals had a 0.5s response window following stimulus onset to lick the spout and receive a water reward. Catch stimuli were delivered on 20% of trials, in which no stimulus was delivered, to test for chance response probability. No penalty or reward was given for a response to a catch stimulus. Note that the cortical microstimulation waveform is not drawn to scale.
D: Microstimulation waveforms. Cortical microstimulation was delivered as either a symmetric current pulse or an asymmetric current pulse. Both symmetric and asymmetric pulses were single pulse, cathode-leading, and charge balanced. Asymmetric pulses had a cathode phase that, relative to the anode phase, was temporally lengthened by a factor of 5 and had amplitude reduced by a factor of 5. For each animal, the duration of the anode phase for both symmetric and asymmetric pulses was fixed at 200, 300, or 400 µs. Stimulus intensity was quantified as the charge delivered per phase of stimulation (in units of nC/phase).

