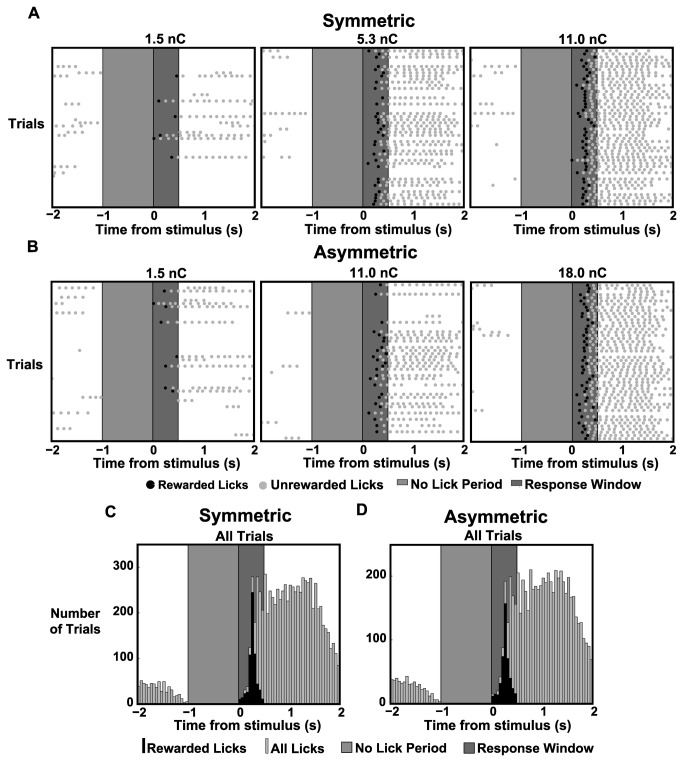
Figure 2. Lick Response Raster Plots and Histograms for Symmetric and Asymmetric Stimulation.
A,B: Lick response raster plots for a single animal (rat 1) with 50 trials shown for three symmetric stimulus intensities and three asymmetric stimulus intensities. The light gray region indicates the minimum 1s “no-lick” period while the dark gray region indicates the 0.5s response window. Tick marks indicate tongue contact with the water spout with black tick marks indicating a response for which a reward was given.
C,D: Histograms from the same animal showing lick responses to all trials for both symmetric and asymmetric stimuli. The black histogram indicates rewarded licks while the gray histogram indicates all licks.

