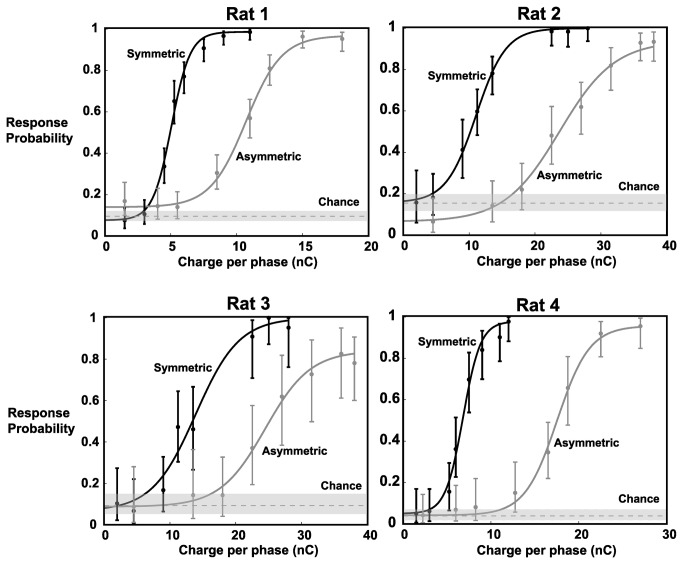
Figure 3. Behavioral Results of Go/No-Go Detection Task.
Psychometric curves for each of the 4 animals indicate an increase in detection threshold with the use of asymmetric pulses. Solid lines represent sigmoidal fits to the response probabilities for the 8 tested symmetric pulse intensities and the 8 tested asymmetric pulse intensities. Chance was measured as the response probability to catch stimuli. With the use of an asymmetric pulse, there was a rightward shift to the psychometric curve, quantified by an average increase of 113.9% in the midpoint (defined as the average between the min and max values). Note different scales for the x-axes for different animals. Error bars represent 95% confidence intervals.

