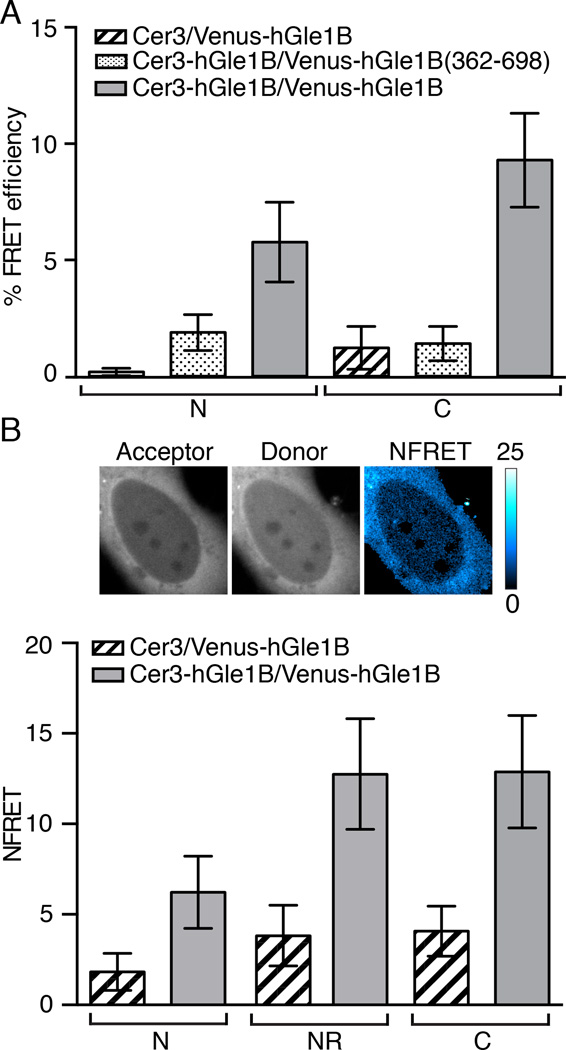
Figure 3. hGle1B self-associates in living cells.
(A) hGle1B self-associates in living cells. Analysis of hGle1B interactions by acceptor photobleaching FRET microscopy in HeLa cells expressing the indicated fluorescent protein FRET pairs. FRET efficiencies of indicated regions were measured. Nucleoplasm and cytoplasm are designated by “N” and “C”, respectively. Error bars represent mean ± 95% confidence interval (CI) with n ≥ 20 cells from two independent experiments. (B) hGle1B self-associates at the nuclear rim. Analysis of sensitized emission FRET at the nuclear rim in HeLa cells expressing the indicated proteins. Shown are representative images of Venus-hGle1B (acceptor), Cer-hGle1B (donor) and the normalized FRET (NFRET) intensity map signal, top. Bar, 10µm. Bar graph depicts the NFRET signal for indicated regions, bottom. Nucleoplasm, cytoplasm, and nuclear rim are abbreviated as “N”,”C”, and “NR”, respectively. Error bars for each condition represent mean ± 95% CI with n ≥ 15 cells from at least two independent experiments.

