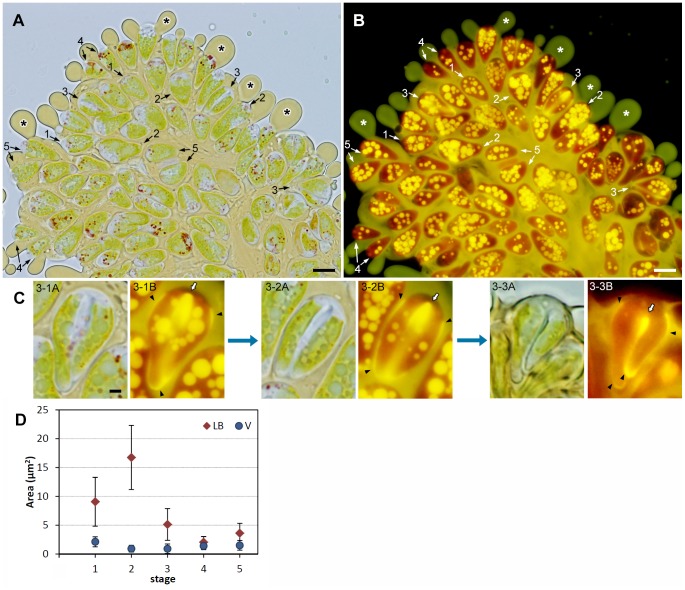
Figure 3. Colony double-stained with Nile red and neutral red.
A. Neutral red, bright-field microscopy. B. Nile red, fluorescence microscopy. Numbers 1–5 with arrows are indicating representative cells or cell pairs at the specific stages of cell cycle as 1; interphase cell, 2; growing cell ∼ cells just after septum formation, 3; cells accumulating lipids between the septum and on the cell surface at basolateral region, 4; a pair of immature daughter cells whose cell area is <2/3 of interphase cell, and 5; A pair of mature daughter cells whose cell area is ≥2/3 of interphase cell. *, exuded lipids from the extracellular matrix. C. Three typical staining patterns seen for cells at the stage 3. 3-1∼3A. Neutral red, 3-1∼3B. Nile red. 3-1. A dividing cell with lipid bodies accumulates lipids at the edge of the septum. 3-2. A dividing cell with a reduced number of lipid bodies accumulates lipids around the septum. 3-3. A dividing cell without lipid bodies filled lipids around the septum. Lipids on the cell surface at basolateral region are also accumulated for these cells. Arrowhead, newly accumulating lipids on the cell surface at basolateral region; white arrow, septum. D. Changes in the total area of lipid bodies (red diamond) and vacuoles (blue circle) per cell. Stage number is corresponding to the number in A/B. For each stage, the average area of the lipid bodies (LB) and vacuoles (V) per cell are shown (n = 50 for each stage, error bars indicate standard deviation). The total area of lipid bodies per cell differed significantly (p<0.01) among the five stages, except for between stage 4 and 5. Scale bars in A, B and C: 10 µm and 2 µm, respectively.

