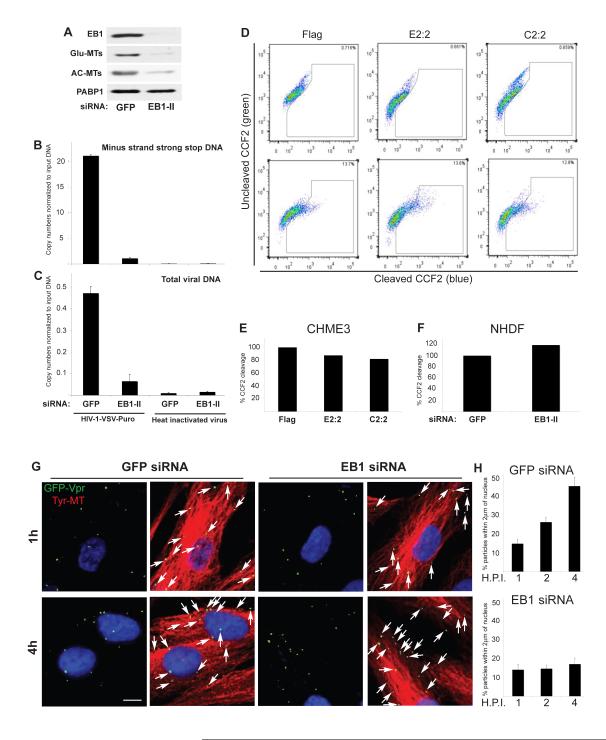
Figure 6. EB1 promotes an early post-fusion stage of HIV-1 infection.
(A-C) Effects of EB1 depletion on HIV-1 DNA synthesis. CHME3 cells were transfected with control GFP siRNA or EB1 siRNA (EB1-II). (A) 24h post-transfection cells were lysed and analyzed by WB using antibodies to EB1, Glu-MTs, AC-MTs or PABP1 (as loading control). (B-C) 24h post-transfection cells were infected with HIV-1-VSV-puro. Low molecular Hirt DNA was isolated at 24 h.p.i. and levels of viral MSS-DNA (B) and total viral DNA (C) in samples were measured by qPCR using primers specific to MSS and puromycin, respectively. Copy numbers were calculated and normalized to input DNA in each sample. Data are represented as mean +/− SEM. (D-F) Effects of EB1 on fusion of HIV-1 cores into the cytosol. (D-E) CHME3 cells expressing Flag, EB1-Flag (E2:2) or EB1-C-Flag (C2:2) were either mock infected (upper panels) or infected with HIV-1-VSV-ZsGreen containing BlaM-Vpr (lower panels). (D) FACS analysis of cells infected at high m.o.i. showing ~13% shift from green (uncleaved CCF2) to blue (cleaved CCF2) cells in Flag, E2:2 and C2:2 clones. (E) Quantification of the effects of E2:2 and C2:2 on HIV-1 fusion at low m.o.i. using the BlaM-Vpr assay, normalized to control Flag lines. (F) NHDFs were treated with control GFP or EB1 siRNAs then infected at low m.o.i. with HIV-1-VSV-ZsGreen containing BlaM-Vpr. Samples were analyzed by FACS and effects of EB1 depletion on HIV-1 fusion were normalized to control siRNA-treated samples. (G-H) EB1 depletion inhibits the translocation of viral particles across the cytoplasm to the nucleus. NHDFs were treated with control GFP or EB1 siRNAs then infected with HIV-1-VSV-GFP-Vpr at m.o.i. 1. (G) After 1h or 4h samples were fixed and stained for Tyr-MTs and GFP. Nuclei were stained with DAPI. Representative images are shown. Scale bar, 10μm. (H) Quantification of the percentage of virions within 2μm of the nucleus in infected cells at 1h, 2h or 4h represented as mean +/− SEM. n≤36 cells and n>400 viral particles per sample. See also Figure S3.

