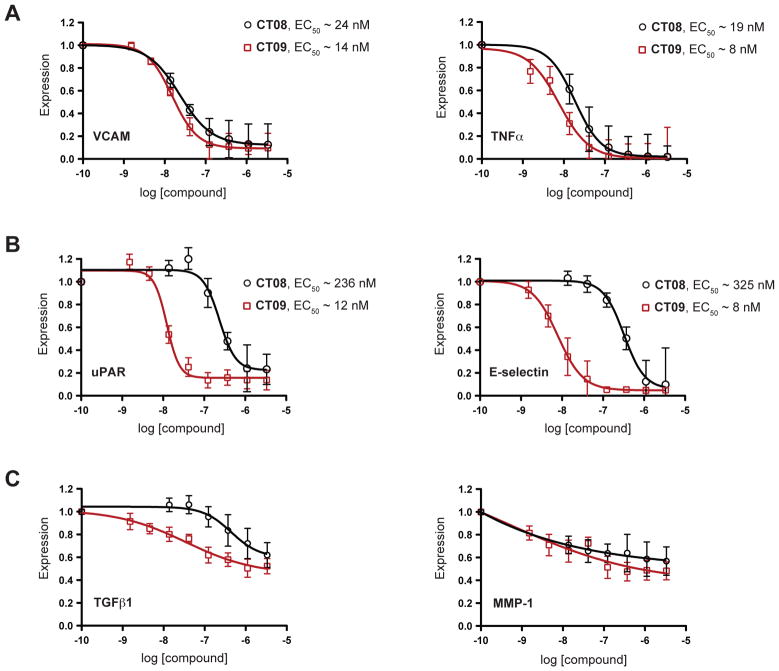
Figure 2. CT08 and CT09 differentially inhibit secretory and transmembrane protein expression.
Primary human cells were stimulated under various pro-inflammatory conditions (see Supplemental Information for details) in the presence of increasing concentrations of CT08 or CT09. After 24 h, expression levels of a total of 25 secreted and membrane proteins (see Table S1 for details) were quantified by cellular immunoassays and normalized to DMSO controls (mean ± SEM; n = 3). EC50 values were estimated by curve-fitting with Prism software (for the complete set of dose-response curves and 95% confidence intervals, along with EC50 values grouped by system, see Figure S1). (A) Class I proteins, VCAM and TNFα, are similarly sensitive to CT08 and CT09. (B) Class II proteins, uPAR and E-selectin, show greater sensitivity to CT09 than CT08. (C) Class III proteins, TGFβ1 and MMP-1, show < 60% inhibition by 3.3 μM CT09 or CT08.

