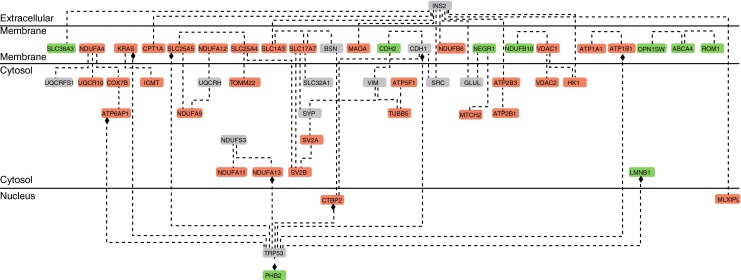
Fig. 2.

Interaction map of differentially abundant retinal proteins in diabetes. A total network was generated with GePS using functional word as connector. Proteins abbreviations are based on official gene symbols (NCBI Entrez Gene). Upregulated proteins are presented in green, downregulated proteins in red and network-extended proteins in grey. The network indicates a moderate degree of functional interaction among proteins affected by diabetes
