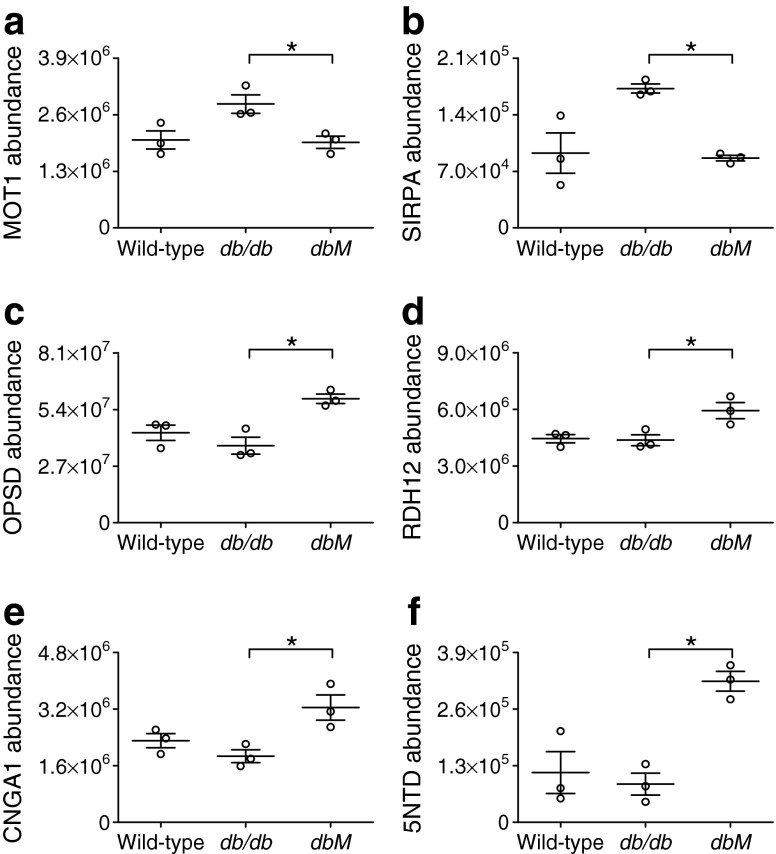
Fig. 6.
Selected significantly different proteins between db/db and dbM treatment groups. Mass spectrometric measurements showed variations in the individual wild-type sample abundances of (a) monocarboxylate transporter 1(MOT1) and (b) signal-regulatory protein alpha (SIRPA), demonstrating that some proteins may not have been identified as significantly altered between wild-type and db/db measurements. However, metformin treatment did change the abundances of non-altered proteins, such as (c) OPSD, (d) RDH12, (e) CNGA1 and (f) 5NTD. *p < 0.05. Protein abundances are arbitrary units

