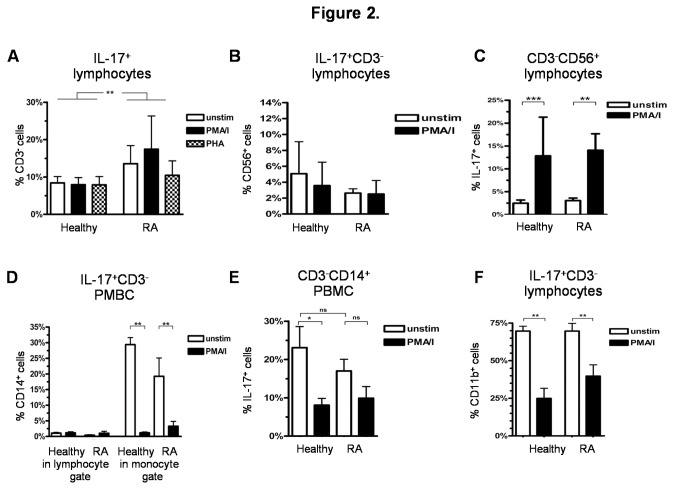
Figure 2. IL-17+ non-T cells.
A-F) Comparative analysis of PBMC stimulated with PMA/i for 20h or incubated in RPMI-1640 medium with the addition of Brefeldin A for 16 h in RA patients and healthy controls; A) Percentage of CD3- non-T cells within IL-17+ lymphocytes (RA n = 20, healthy controls n = 20); B) Percentage of CD56+ NK cells within IL-17+CD3- non-T cells; C) Percentage of IL-17+ cells within CD3-CD56+ NK cells; D) Percentage of CD14+ monocytes in IL-17+CD3- non-T cells within the lymphocyte gate and within the monocyte gate (FSC vs. SSC); E) Percentage of IL-17+ cells within CD3-CD14+ monocytes within the monocyte gate; F) Percentage of CD11b+ cells within IL-17+CD3- lymphocytes.
Data B)-F) PMBC of healthy controls (n = 8) and RA patients (n = 8).
*p < 0.05, **p < 0.01, ***p < 0.001, ns = not significant, column represents the mean and bars indicate 95% CI.

