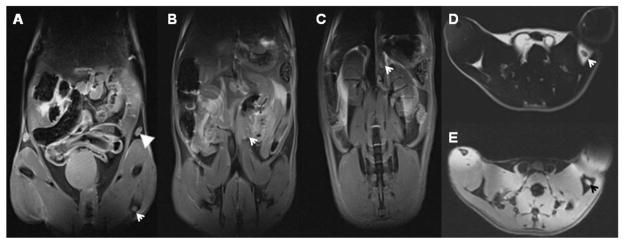
Figure 2.

HR-MRI mapping of mouse LN in vivo: The corresponding the LNs labeled using 1% India ink (Figure 1) are showed in Figure 2. A, B, and C with a fat suppression MRI technique, the coronal views of the inguinal (A, arrowhead), popliteal (A, arrow), iliac (B, arrow), and renal (C, arrow) LNs in T2W images of the normal mouse. D (without a fat suppression, where the fat exhibits high signal intensity) and E (with a fat suppression, where the fat exhibits low signal intensity) are transverse T1W and T2W images of popliteal LN, respectively. MRI resolution is 0.14 × 0.14 × 0.14 mm3.
