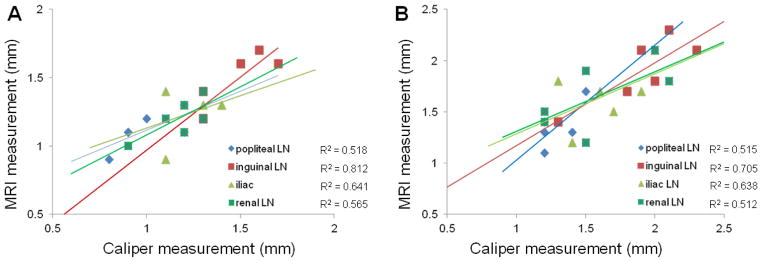
Figure 5.

Graphs show the relationship between HR-MRI measurements in vivo and ex vivo 1% India ink measurements of LNs from normal mice (A) and panc-2 mice (B) (each n = 6), the 95% confidence interval for linear regression of size on HR-MRI. There was a strong correlation between the MRI and caliper measurements in each LN (A and B).
