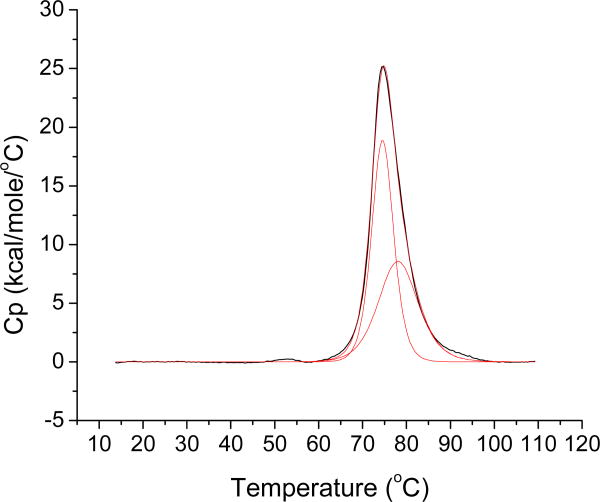
Figure 1.
Differential scanning calorimetry profile for a 0.3 mM N-NFU solution in phosphate buffer. Origin was used to fit the data to a 2-peak, non-2-state model (MN2State). Values for Tm, ΔHcal and ΔvH were obtained from the fit and are listed in Tables 1 and 2. The lower melting point was initialized at 79.4 °C, which was obtained from a VTCD analysis.

