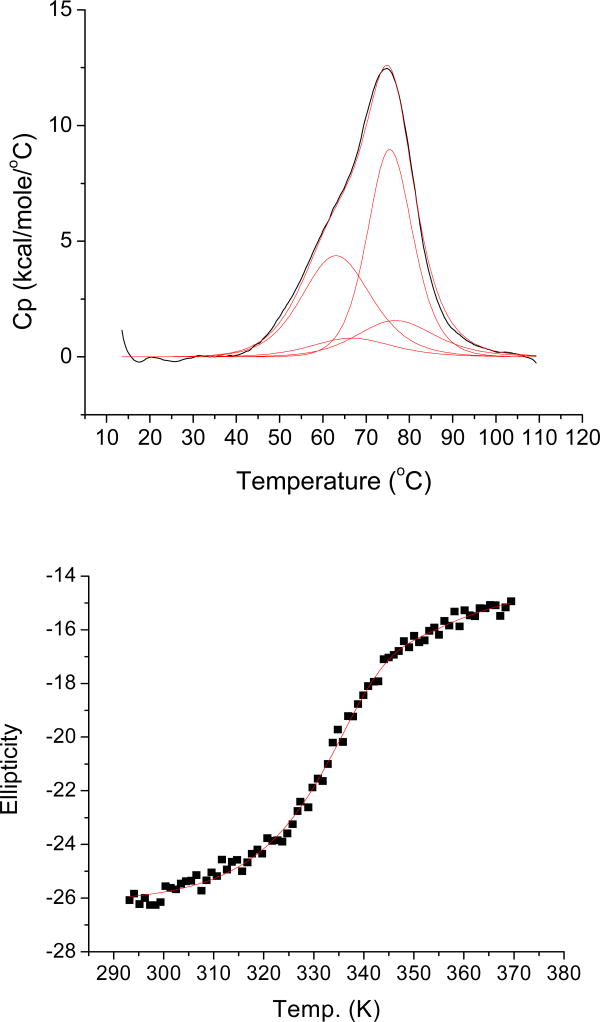
Figure 4.
DSC and VTCD analysis of NFU in 40 mM phosphate 100 mM NaCl buffer. (Top) Upscan of 0.3 mM NFU from 10 °C to 110 °C at a rate of 1 K/min recorded by DSC. (Bottom) Upscan of 10 μM NFU under the same conditions, but monitored at 222 nm by CD. VTCD data were fit to equation 2 and results are listed in Tables 4 and 5. Fitting results from DSC experiments are listed in Tables 1 and 2.

