
Figure 1.
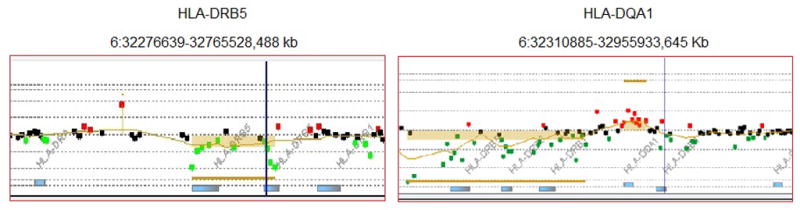
CGH result for CNVs of the DRB5 and DQA1 regions. Red dots indicate increase hybridization signal, green dots represent decreased hybridization signal, and copy number alterations are called and marked with colored bars.
Official websites use .gov
A
.gov website belongs to an official
government organization in the United States.
Secure .gov websites use HTTPS
A lock (
) or https:// means you've safely
connected to the .gov website. Share sensitive
information only on official, secure websites.
CGH result for CNVs of the DRB5 and DQA1 regions. Red dots indicate increase hybridization signal, green dots represent decreased hybridization signal, and copy number alterations are called and marked with colored bars.