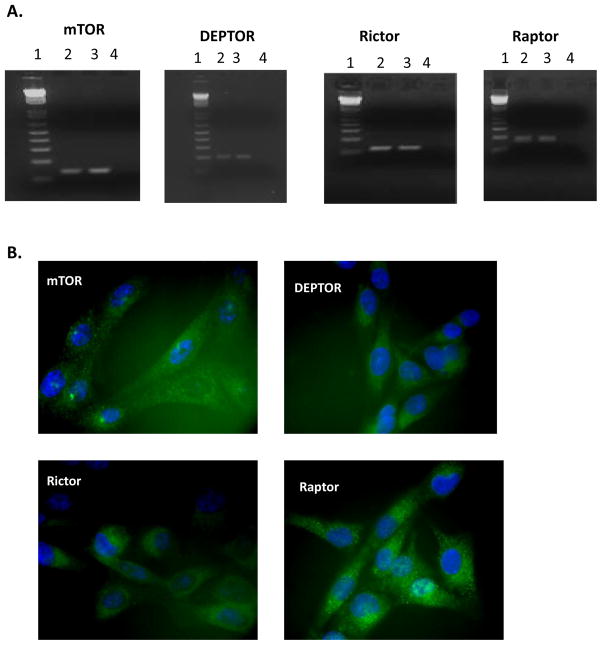
Figure 2. The ULTR myometrial cell line expresses mTOR, DEPTOR, Rictor and Raptor at mRNA and protein level.
Immunofluorescent analysis indicates a strong cytoplasmic distribution with mTOR and Raptor. Expression and cellular distribution of mTOR components in ULTR cells. Panel A: Lane 1 DNA marker, Lane 2 cDNA from BeWo cells (positive control), lane 3: cDNA from ULTR cells, and lane 4: negative control RT−). Panel B: Representative images showing cellular distribution of mTOR, DEPTOR, Rictor and Raptor in ULTR cells using immunofluorescent analysis. Magnification x40

