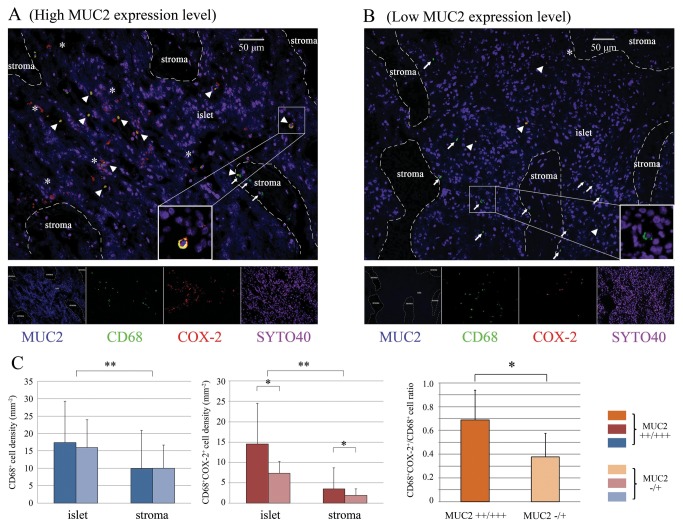
Figure 2. Distribution characteristics of CD68+COX-2+ TAMs in the ovarian cancer tissue.
(A) CD68+COX-2+ TAMs in a representative cancer tissue section from the high MUC2 expression group were shown. (B) CD68+COX-2+ TAMs in a representative cancer tissue section from the low MUC2 expression group were shown. Nuclei were stained with SYTO 40, shown in purple. Arrowhead, CD68+COX-2+ TAMs. Arrow, CD68+COX-2- TAMs. Asterisk, COX-2+ cancer cells (CD68-) surrounding the CD68+COX-2+ TAMs. (C) The intratumoral densities of CD68+ TAMs and CD68+COX-2+ TAMs and the CD68+COX-2+/CD68+ TAM ratios of the high and low MUC2 expression groups were compared, as were the corresponding values for the cancer islet and stromal regions. It could be found that the ratio of CD68+COX-2+/CD68+ TAMs was significantly higher in the high MUC2 expression group than in the low MUC2 expression group *, p<0.05, Student’s t-test. **, p<0.05, ANOVA.

