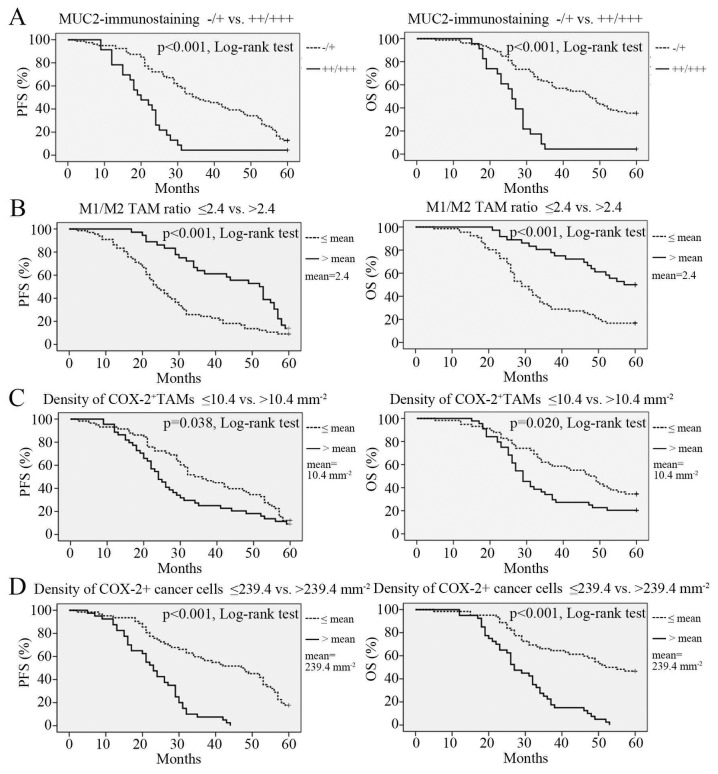
Figure 5. Kaplan–Meier 5-year PFS and OS curves for ovarian cancer patients stratified by four pathological parameters of interest.
(A) MUC2 expression level, low (immunostaining -/+) vs. high (immunostaining ++/+++). (B) M1/M2 ratio, lower vs. higher than the mean value. (C) COX-2+ TAM density, lower vs. higher than the mean value. (D) COX-2+ cancer cell density, lower vs. higher than the mean value. PFS, progression-free survival. OS, overall survival.

