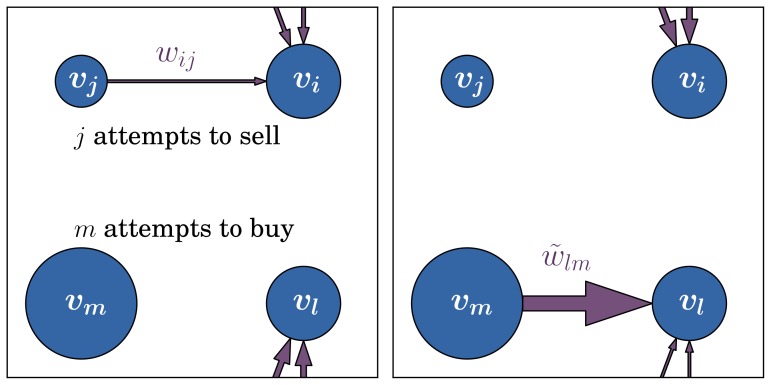
Figure 2. Illustration of the adaptive process.
Snapshots before the rewiring (left) and afterwards (right), where the edge  was deleted from the graph (company
  gave up its shares of
  ), and new edge
  was added (company
  bought shares of company
  ). Important links with high values
  are favored according to the replacement probability of Eq. 3.

