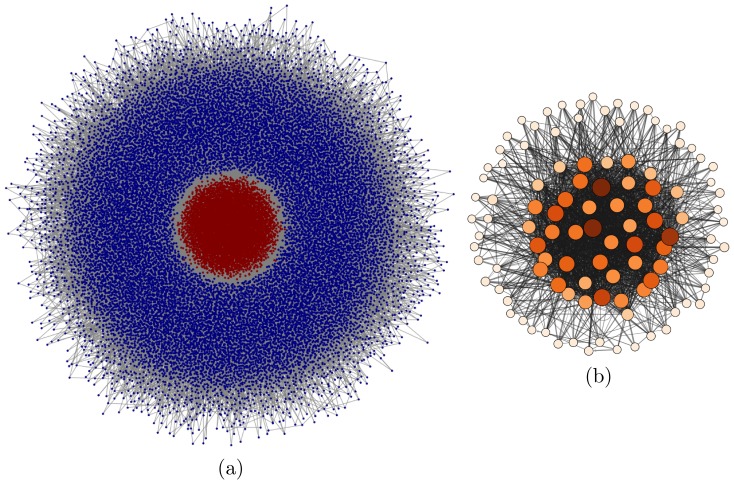
Figure 4. Emergence of a core-perephery structure.
(a) Graph layout of the whole network, with red nodes representing a chosen fraction of the most highly connected core, and blue ones the periphery, for  , a control propagation value of
  ,
,  and
and  ; (b) Subgraph of the most powerful companies with
  (about 100). The node colors and sizes correspond to the
  values.

