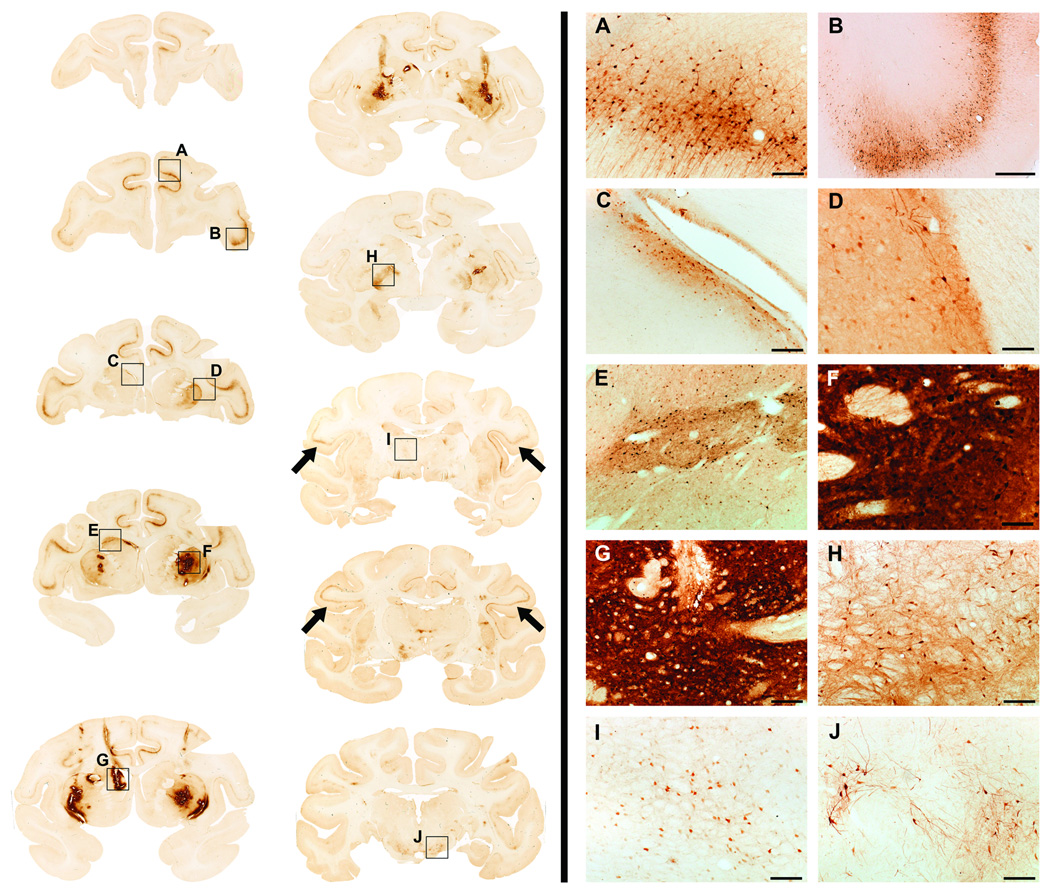
Figure 2. GFP expression throughout the brain.
Left side of the panel shows brain coronal section stained against GFP in a representative animal. Note the presence of GFP-positive staining in both infusion sites [caudate nucleus (Cd; C, E and G) and putamen (Put; D and F)] as well as in distal regions such as the prefrontal cortex (PCx; A, B), parietal cortex (black arrows), external globus palidus (eGP; H), thalamus (Th, I) and substantia nigra pars compacta (SNpc; J).
Right side: High magnification images of the areas inside black squares are shown on the right side of the panel (A-J). Scale bars: A, C, G-J: 200 µm; B: 1 mm; D-F: 100 µm.

