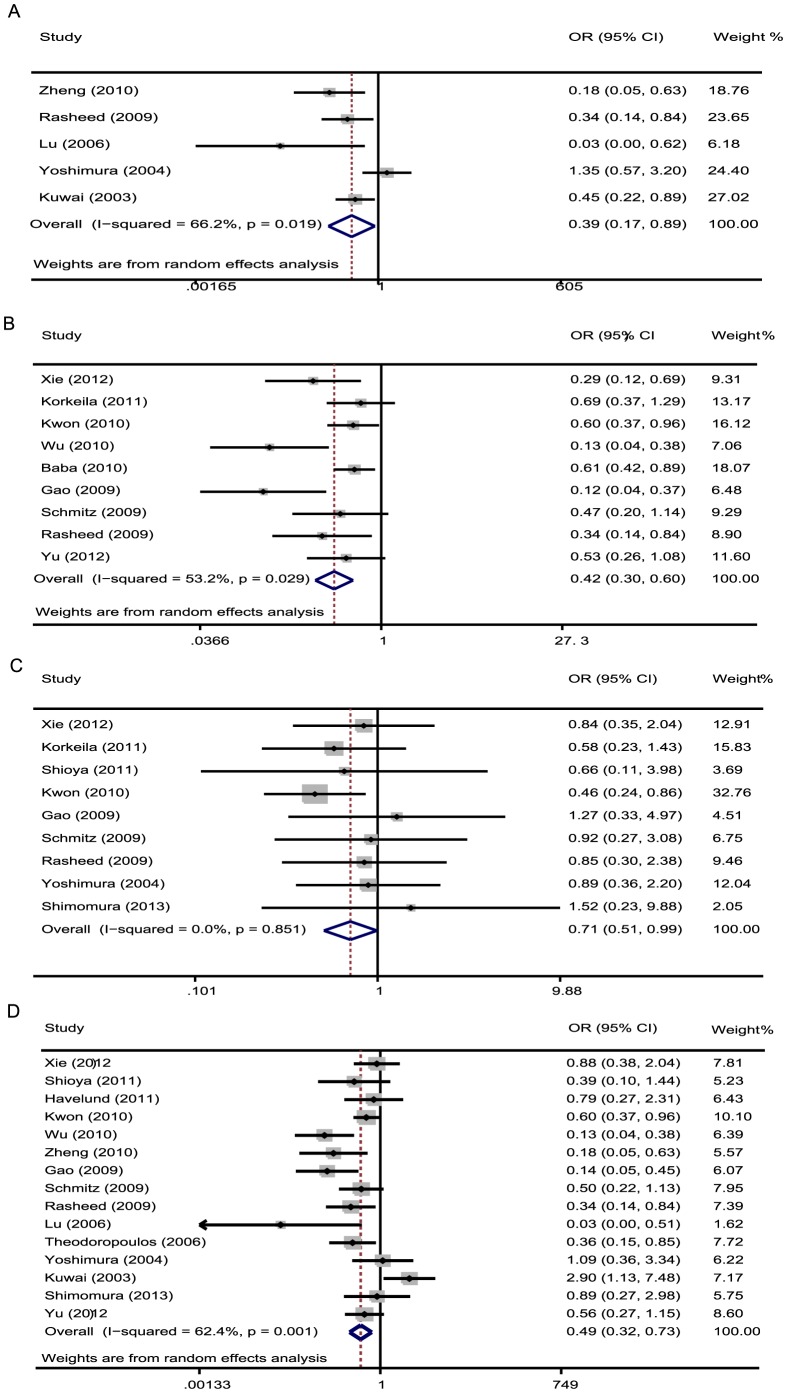
Figure 4. Forrest plot of odds ratios (ORs) for the association of HIF-1α expression with clinicopathological features.
A. ORs with corresponding 95% CIs of the HIF-1α expression with Dukes' stages. OR<1 suggested that unfavorable parameters for the group with increased HIF-1α expression/negative. Overexpressed HIF-1α was associated with advanced Dukes' stage of CRC. B. ORs with corresponding 95% CIs of the HIF-1α overexpression with UICC stage. OR<1 suggested that unfavorable parameters for the group with increased HIF-1α expression/negative and HIF-1α overexpression was associated with advanced stage of CRC. C. ORs with corresponding 95% CIs of the HIF-1α overexpression with depth of invasion. D. ORs with corresponding 95% CIs of the HIF-1α overexpression with lymphnode metastasis.

