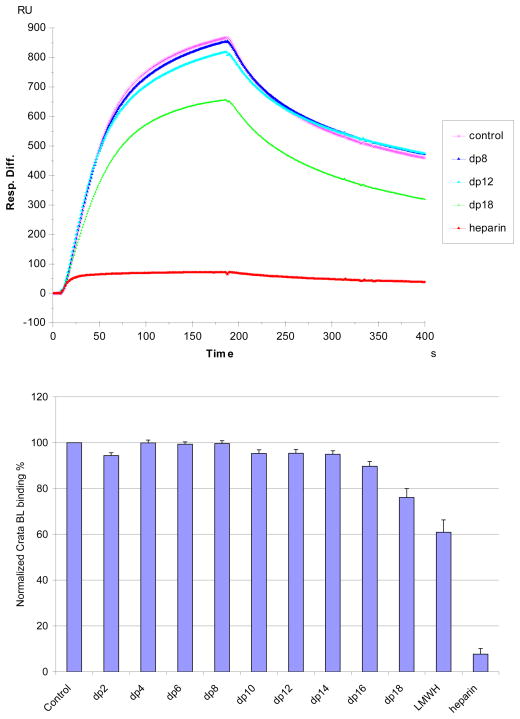
Figure 4.
Top: Sensorgrams of solution heparin oligosaccharides/surface heparin competition. CrataBL concentration was 125 nM, and concentrations of heparin oligosaccharides in solution were 1000 nM). Bottom: Bar graphs (based on triplicate experiments with standard deviation) of normalized CrataBL binding preference to surface heparin by competing with different size of heparin oligosaccharides in solution.

