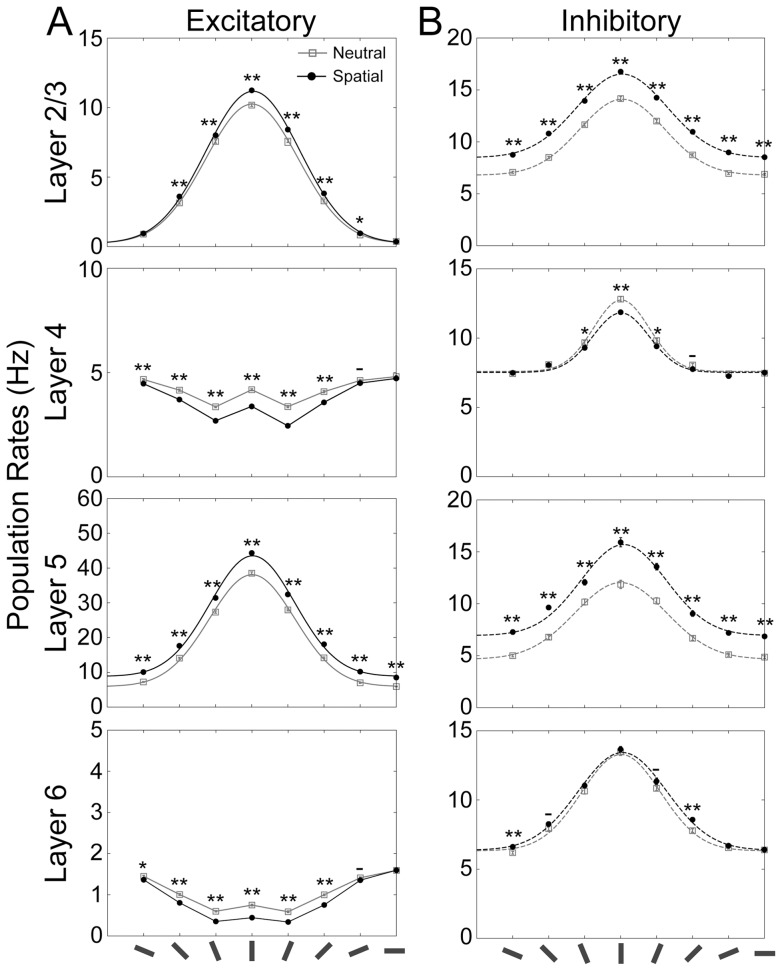
Figure 3. Model responses to a vertical bar for both neutral condition and spatial attention.
The population rates of excitatory (A) and inhibitory (B) neurons for each layer of the microcircuit model are represented by solid and dashed lines, respectively. Oriented bars at the bottom present the preferred orientation of each layered microcircuit. Gray and black lines show the responses of the model without attentional input (neutral condition) or during spatial attention, respectively. The tuning curves of L2/3 and L5 excitatory neurons and inhibitory neurons in all layers were fitted to Gaussian distributions. Asterisks indicate that the differences in the population firing rates between the 2 conditions for this oriented bar was statistical significant (t-test: ** for p<0.01; * for p<0.05; – for p<0.1).

