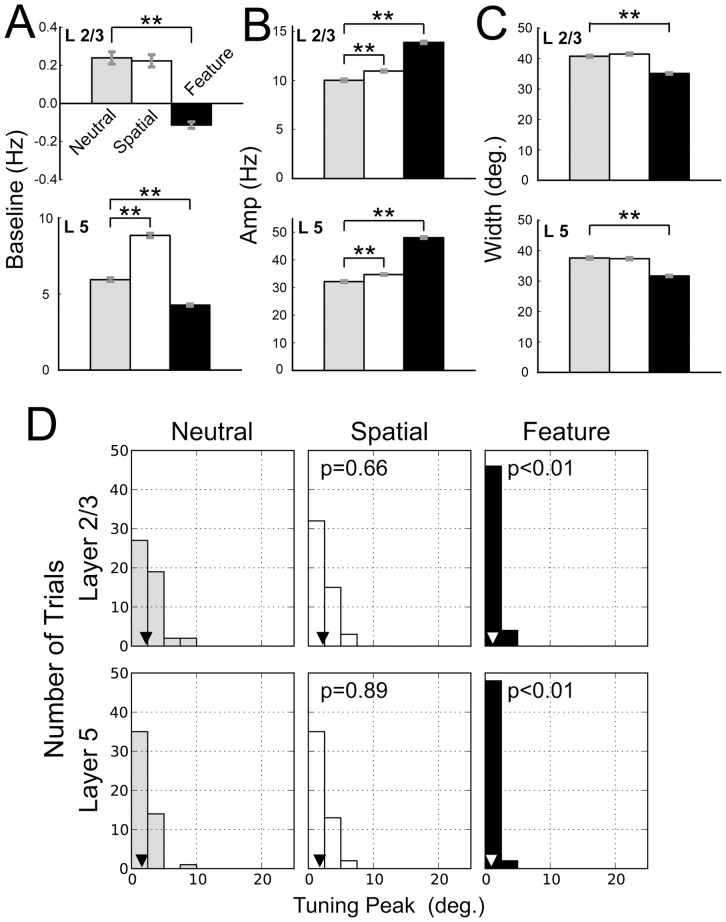
Figure 5. Statistical analyses of the orientation tuning curves.
A, B, C, The baselines, amplitudes, and widths of the Gaussian tuning curves for the responses of excitatory neurons in L2/3 (upper) and L5 (lower) are shown. The values of the Gaussian fitting parameters were obtained from 50 simulation trials in the neutral condition (gray bars), spatial attention (empty bars), and feature-based attention (filled bars). Asterisks indicate that the parameter values were significantly different from those in the neutral condition (t-test: ** for p<0.01; * for p<0.05; – for p<0.1). D, The histograms of the absolute peak locations of the tuning curves in L2/3 and L5 are shown for a vertical bar stimulus. Triangles show the median values. We calculated P values for Mann-Whitney test to compare the histograms between the neutral condition and the 2 attentional conditions. Feature-based attention significantly improved the detection of the presented orientation.

