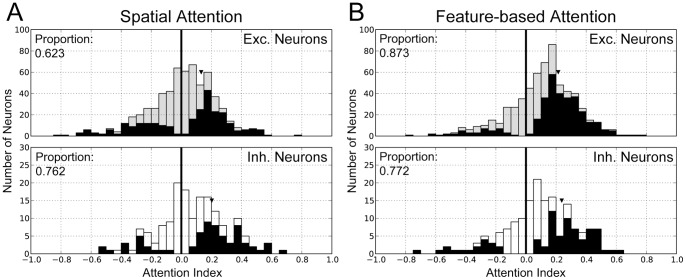
Figure 6. Distributions of attention indices (AIs) over excitatory and inhibitory neuronal populations in L2/3 and L5.
A, The distributions of attention indices are displayed for spatial attention. The distributions of excitatory neurons (gray bars, upper panels) and those of inhibitory neurons (empty bars, lower panels) are depicted. In all panels, filled bars indicate the neurons showing statistically significant modulations by attention (t-test, p<0.01). Triangles show the median values. B, Similar distributions of attention indices are shown for feature-based attention.

