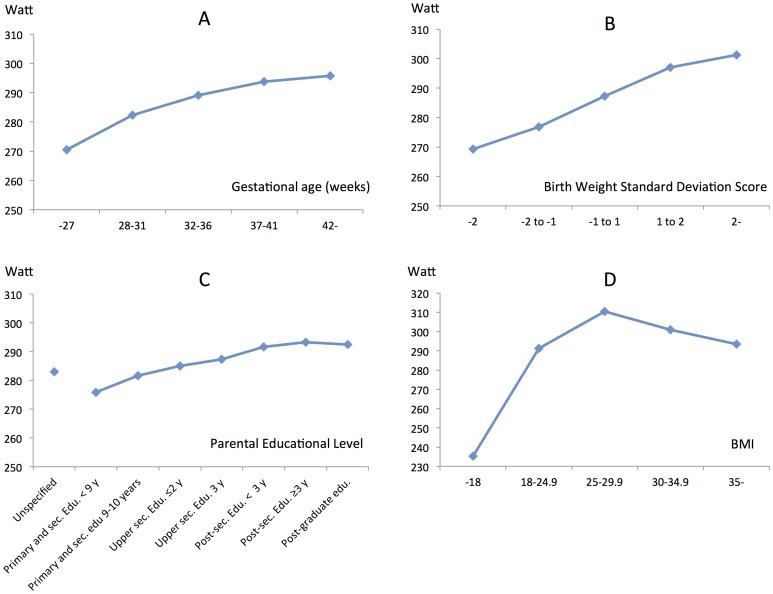
Figure 2. Maximal exercise capacity.
Adjusted results expressed as least squared means for maximal exercise capacity (Watt) in relation to the major risk factors. A - Gestational Age categories, B - Birth Weight Standard Deviation Score, C – Education level of the parents and D - BMI. Sec edu. = Secondary education, y = years, BMI = Body Mass Index.

