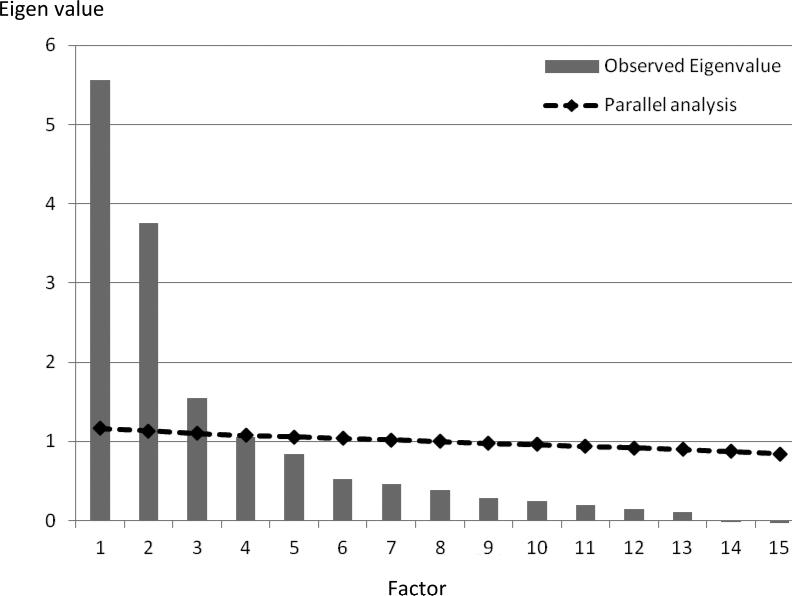
Figure 1. Scree plot and parallel analysis from exploratory factor analysis (EFA).
The vertical lines depict the eigenvalues for each factor, showing a turn at factor 3. The solid line depicts the upper bound of the 95% confidence interval for eigenvalues that would be expected for each factor from an EFA computed on a random dataset of the same size as the actual data. As can be seen, the observed eigenvalues for the first 3 factors exceed the chance line, consistent with the scree plot interpretation.

