
Figure 2.
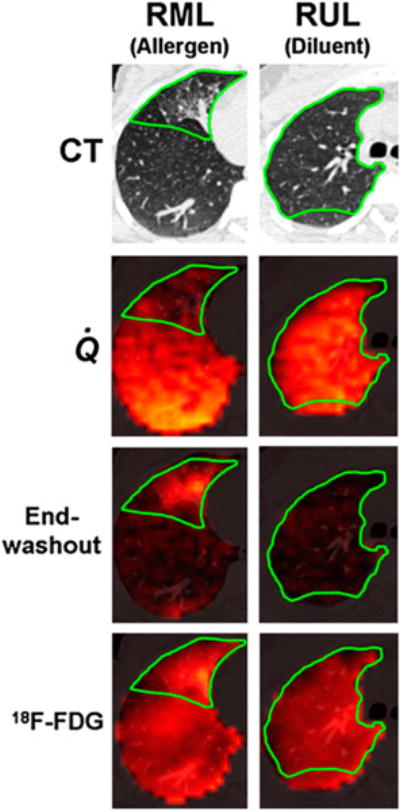
Example images. First row: Axial CT slice through RML and RUL, where allergen and diluent, respectively, were administered. Green border shows approximate location of RML and RUL. Second row: Fused perfusion images from 13NN-saline PET scan during breath-hold and CT. Perfusion is reduced in allergen region but normal in diluent region. Third row: Fused end-washout image from 13NN ventilation scan and CT. Ventilation-defective area in region of allergen challenge manifests as tracer retention at end of washout. In contrast, no residual tracer was present in diluent region by end of washout. Fourth row: 18F-FDG scan showing increased uptake in allergen region, compared with diluent region.