
Figure 6.
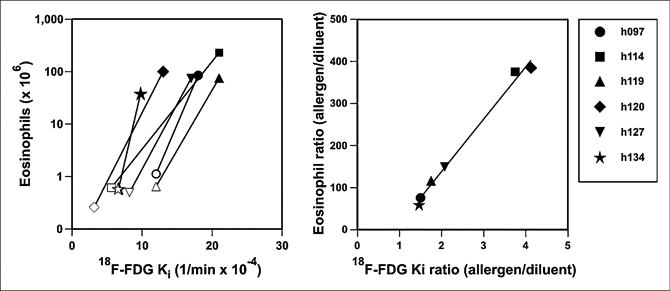
Eosinophil count vs. Ki and eosi-nophil count ratio (allergen to diluent) vs. Ki ratio. Each subject is represented by different symbol. All subjects had increase in Ki and eosinophil count in allergen-challenged region (dark symbols), compared with diluent region (open symbols). Eosinophil count ratio was highly correlated (R2 = 0.9917, P < 0.001) with Ki ratio. Equation of regression line is eosinophil count ratio 5 124 × Ki ratio − 110.