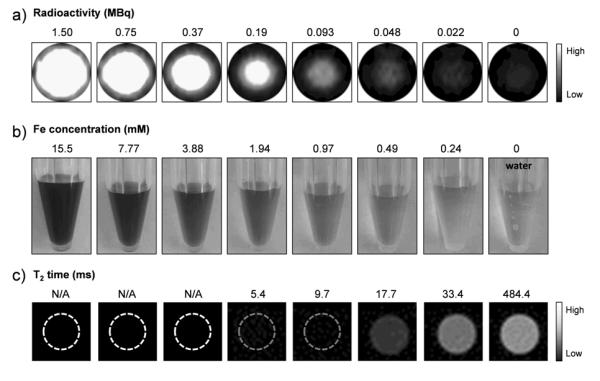
Figure 2.
(a) PET imaging of *As-SPION (in 0.25 mM HEPES buffer) with varied radioactivity level (from 0 to 1.50 MBq). (b) Digital photos and (c) corresponding T2*-weighted MR images of SPION@PAA with varied Fe concentrations from 0 to 15.5 mM. T2 relaxation time was too short to be measured at Fe concentrations equal to or exceeding 3.88 mM (indicated by dashed circles).

