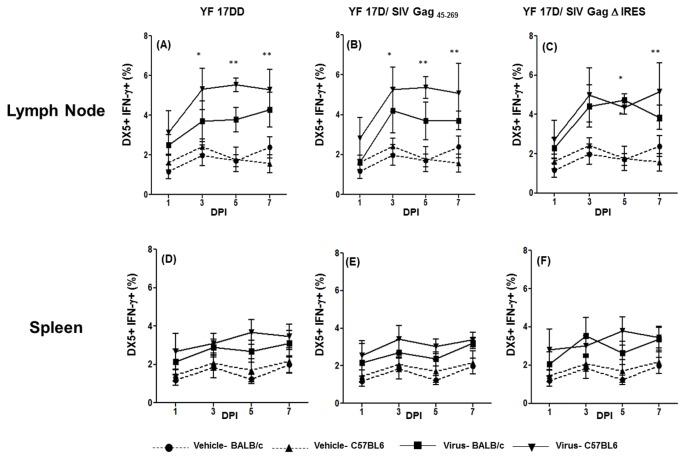
Figure 2. Production of IFN-γ by NK cells in the first week after 17DD and 17D/ SIV Gag recombinants immunization in mice.
Percentages of DX5+ IFN-γ+ cells in draining lymph nodes and spleens of mice following 17 DD – (Lymph node-panel A; Spleen- panel D), 17D SIV Gag 45-269 (Lymph node-panel B; Spleen- panel E) and 17D Δ IRES (Lymph node- panel C, Spleen- panel F) immunization in C57BL/6 and BALB/c mice. Statistical analysis was performed by Two- Way ANOVA with Bonferroni post-test. * p<0.05, ** p<0.01, *** p<0.001. The means are representative of three independent experiments. N= 3 animals/ experimental point.

