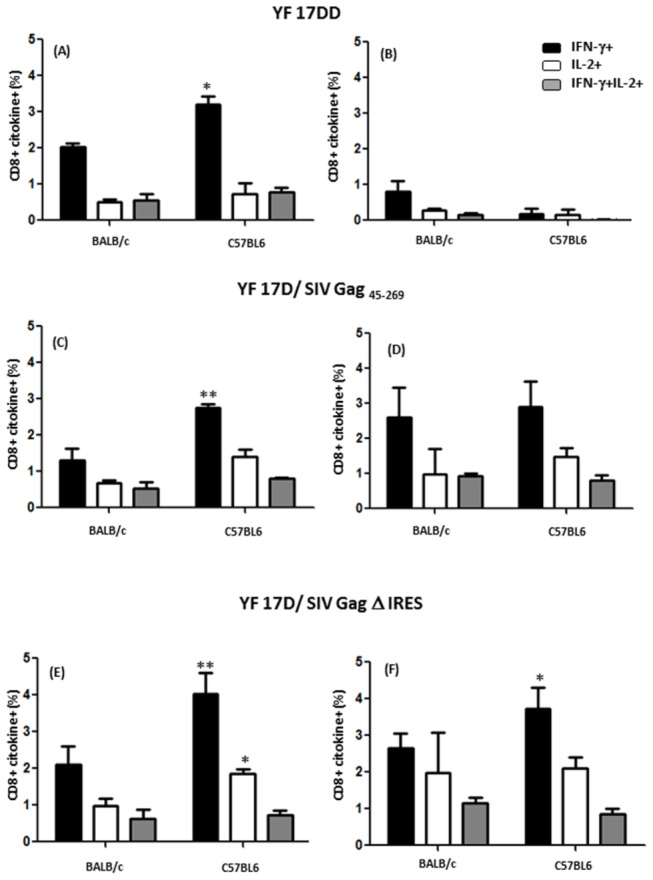
Figure 6. Functional profile of CD8+ T cell responses in mice immunized with 17DD and 17D/ SIV Gag recombinants.

ICCS for YF-specific and Gag-specific CD8+ T-cells at day 14 after immunization on secretion of IFN-γ and/or IL-2 following stimuli with antigen (whole inactivated YF 17DD virus -panels A, C and E and peptide mixtures spanning amino acids 1–291 of Gag -panels B, D and F). Bar graphs indicate the mean frequency of CD8+ splenocytes specific to YF and Gag capable of producing IFN-γ (black), IL-2 (white) or both (grey). Error bars represent the standard error of the mean. Differences between cytokine + cells were statistically significant between BALB/c and C57BL/6 mice (* p<0.05, **p<0.01). The means are representative of three independent experiments. N= 4 animals/ experiment.
