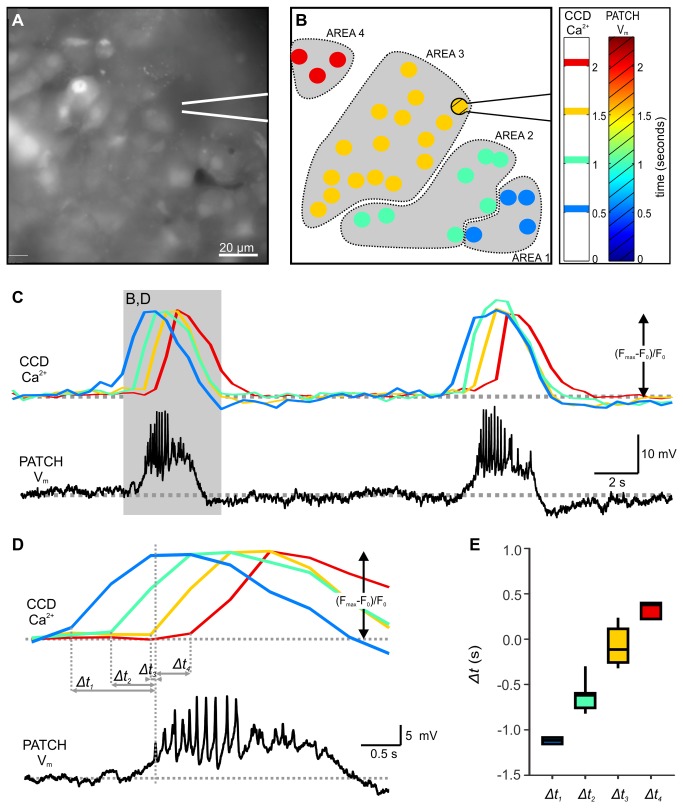
Figure 1. Simultaneous recording of membrane potential oscillations occurring in the patch-clamped cell and [Ca2+]i oscillations occurring in other cells of the same islet of Langerhans.
A [Ca2+]i oscillations were measured with a CCD camera at a temporal resolution of 2 Hz in cells in the tissue slice loaded with OGB-1. The patch-clamp pipette position is indicated with white lines. B During stimulation with 12 mM glucose, [Ca2+]i oscillations spread across the plane of the islet (from the lower right to the upper left corner in this figure). Responses of cells shown in A during a single [Ca2+]i oscillation are color-coded to represent time lags between the onset of [Ca2+]i increase in the cell where the visible part of the oscillation started and every other cell. Due to temporal resolution (2 Hz), cells were grouped into 4 groups only. The position of the patch-clamp pipette and the patch-clamped cell is indicated. The hatched pattern in the figure and legend bar indicates patch-clamp Data. C Two consecutive [Ca2+]i (upper panel) and membrane potential (lower panel) oscillations during stimulation with glucose. Each [Ca2+]i oscillation was accompanied by a membrane potential change consisting of a depolarization with superimposed spikes followed by a repolarization. Membrane potential was recorded at a temporal resolution of 1000 Hz. D A more detailed representation of the area indicated in C. The onset of high frequency spikes in the patched cell is temporally best correlated with the onset of [Ca2+]i oscillation in the group of cells indicated in orange. For this group of cells the distance to oscillation origin was roughly the same as for the patched cell. E Time delays between the first spike in the patch-clamped cell and the onset of [Ca2+]i oscillation in every other cell. Shortest time delays correspond to the orange group of cells for which the distance to wave origin was roughly the same as for the patch-clamped cell. Color coding as in B-D.

