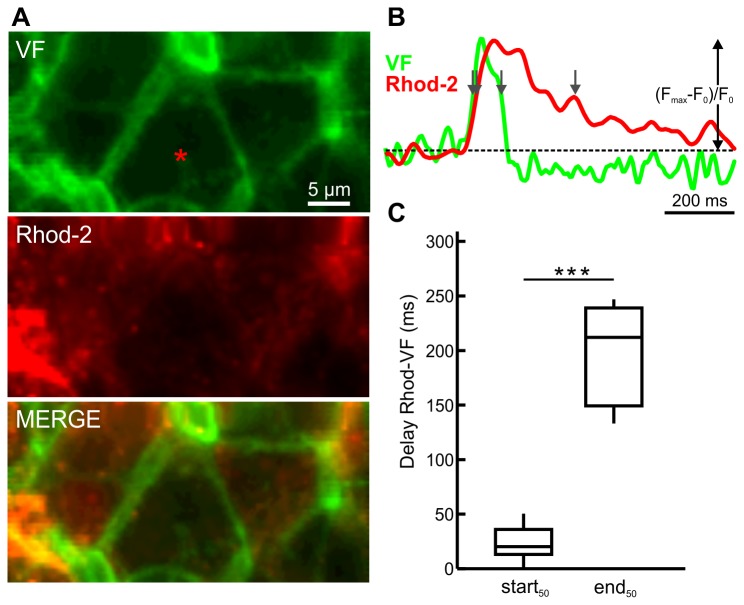
Figure 7. Simultaneous recording of [Ca2+]i and membrane potential oscillations during stimulation with 12 mM glucose plus 10 mM tetraethylammonium (TEA).
A The voltage sensitive dye VF (upper panel) stained mostly cell membranes, whereas the calcium indicator Rhod-2 (middle panel) stained cytoplasms. For the active cells no significant co-localization was observed (lower panel). B Oscillation in the cell indicated with red asterisk in A during stimulation with 12 mM glucose plus 10 mM TEA. Arrows indicate the widths of oscillations at their half-maximal amplitude. Y axis represents the normalized fraction of the difference between maximum and plateau baseline fluorescence. C The delay between start50 of the Rhod-2 and VF signals (1st quartile=13 ms, median=20 ms, 3rd quartile=36 ms, n=11 cells from 4 islets) was statistically significantly shorter than the delay between end50 of the Rhod-2 and VF signals (1st quartile=150 ms, median=212 ms, 3rd quartile=239 ms, n=11 cells from 4 islets). Asterisks indicate p<0.001 (Mann-Whitney test). Resolution was 128x64 pixels at 170 Hz.

