
Figure 1. Photoactivation of mt-PAGFP.
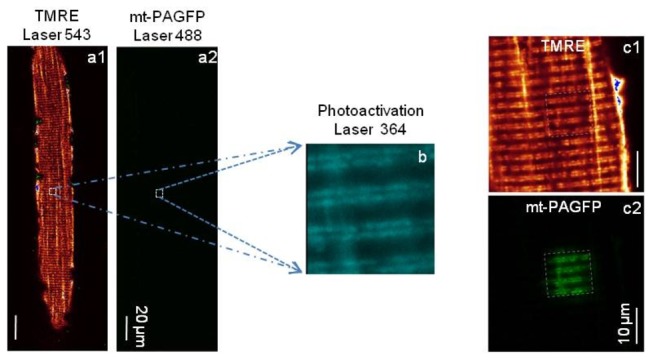
Simultaneous recording of TMRE (a1) and mt-PAGFP (a2) images. Before photoactivation, there is no GFP fluorescence of mt-PAGFP detected in a2. A small area (~ 10 X 10 µm2) of the fiber was photoactivated by a 364 nm laser (b). After photoactivation, the fiber was imaged again simultaneously for both TMRE (c1) and mt-PAGFP (c2) at the fiber region including the area with photoactivated GFP. Note the visible GFP fluorescence of mt-PAGFP in c2 recorded at the same laser intensity as in a2.