
Figure 5. Migration of mt-SOD1-Dendra and mt-SOD1G93A-Dendra in normal muscle fibers.
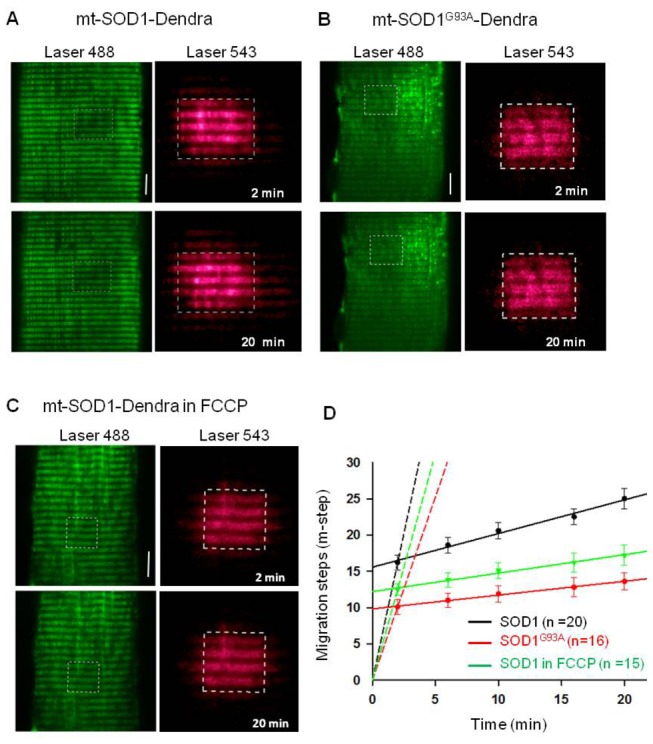
Representative images of muscle fibers expressing mt-SOD1-Dendra (A) or mt-SOD1G93A-Dendra (B). Before photoactivation Dendra was a green fluorescent protein (green images in left panels). A small region of the fiber was photoactivated. The photoactivation region in the fiber was marked with the box (white dashed line). After the photoactivation Dendra was converted to a red fluorescent protein (red images in right planes). (C) Migration of mt-SOD1-Dendra in the presence of 200 nM FCCP. Bar: 10 µm. (D) The migration time course of the red fluorescent protein. Solid lines are the linear regression of the data after 2 minutes of the photoactivation. Dashed lines are the linear regression of the data in the first 2 minutes, assuming the migration step is zero at time zero. The migration rates are listed in Table 1 . (P<0.01).