
Figure 6. A-C.
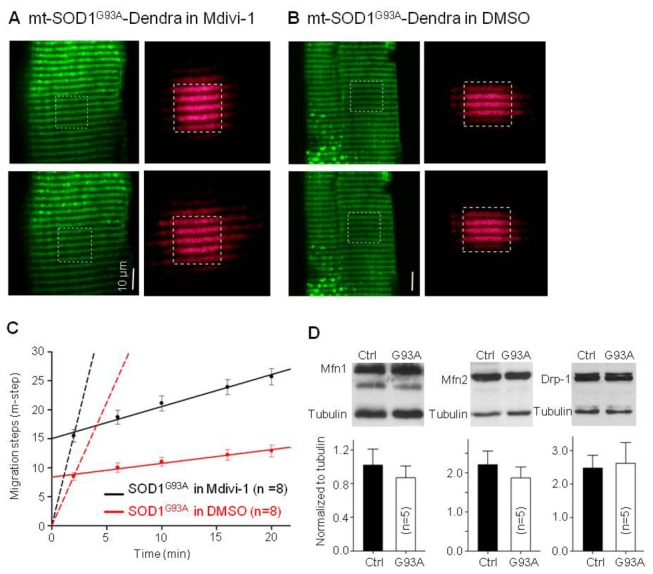
The effect of Mdivi-1 on migration of mt-SOD1G93A-Dendra expressed in normal muscle fibers.
(A) Migration in the presence of Mdivi-1; (B). Migration in DMSO as a control. (C) The migration time course of mt-SOD1G93A-Dendra. Solid lines are the linear regression of the data after 2 minutes of the photoactivation. Dashed lines are the linear regression of the data in the first 2 minutes. The migration rates are listed in Table 1 . (P<0.01). Note, Mdivi-1 closely restored the migration rate of mutant mt-SOD1G93A-Dendra. (D) Western blot analysis of Mfn1, Mfn2 and Drp1 in skeletal muscle of G93A and control (ctrl) mice. There are no significant changes in expression level of these mitochondrial fusion/fission proteins in G93A muscle at the age of 2 month. (n=5 mice for control and G93A respectively).