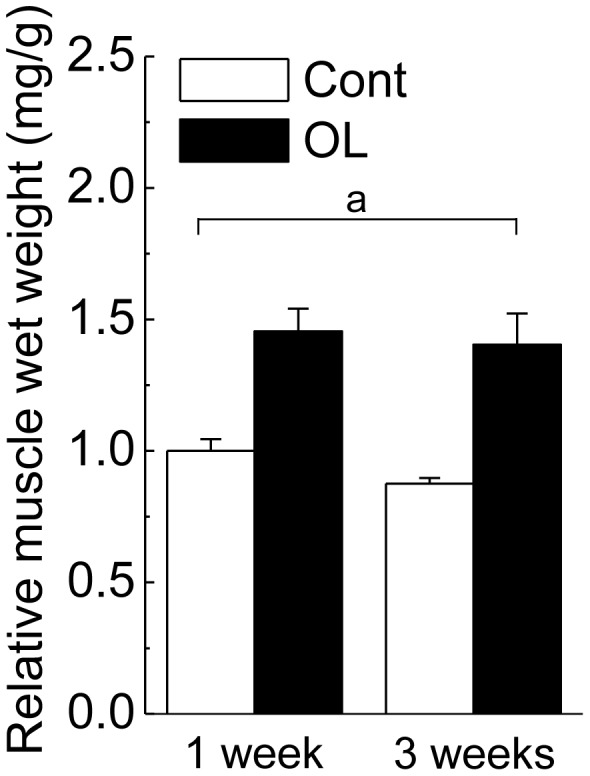
Figure 2. Changes in soleus muscle wet weight in response to functional overloading.

The values show the muscle wet weight relative to body weight. Cont: untreated control group, OL: functional overloaded group, 1 week and 3 weeks: 1- and 3-week of functional overloading. Mean ± SEM. n = 5/group at each time point. pone.0081929.a.tif: a significant effect of treatment (p<0.05) revealed by two-way ANOVA (treatment and time).
