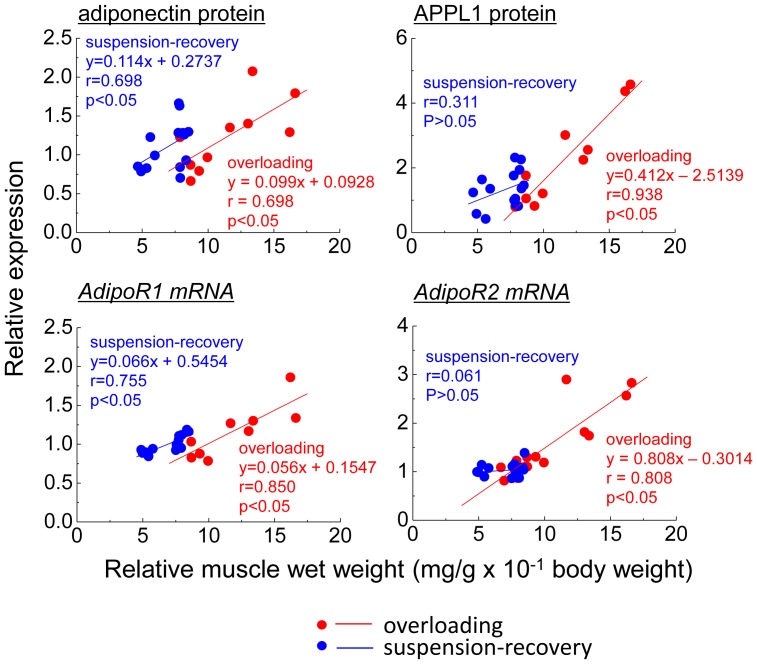
Figure 6. Interrelationship between soleus muscle wet weight relative to body weight and the expression levels of the expression levels of adiponectin protein, APPL1 protein, AdipoR1 mRNA or AdipoR2 mRNA.
Red circle: data from the experiment of functional overloading experiment (contralateral control and following 3 weeks of functional overloading). Blue circle: data from the experiment of hindlimb suspension and recovery (before, 2 weeks of the suspension, and 2 and 4 weeks of recovery following the suspension). A linear regression line was calculated by using of data each experiment in each graph.

