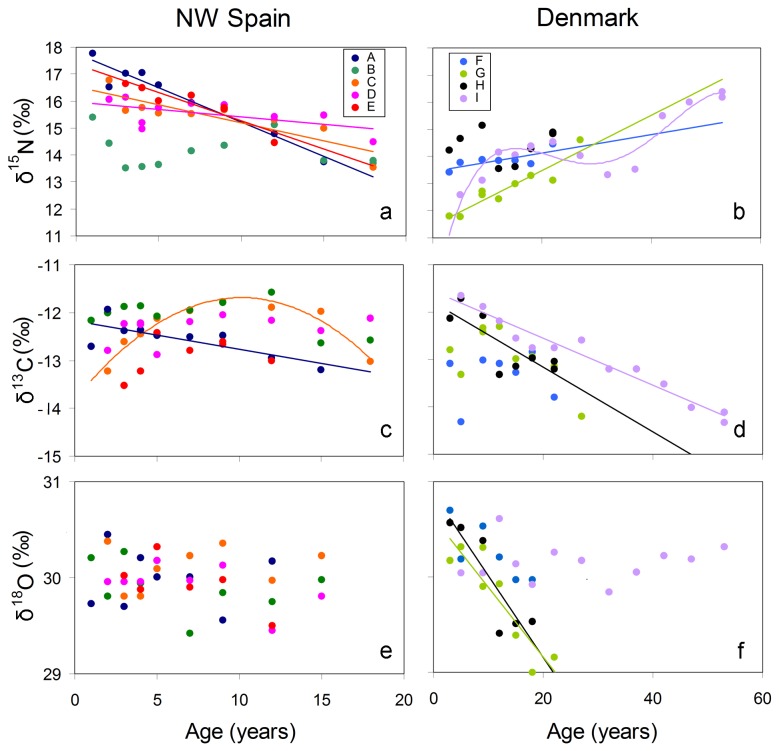
Figure 4. Relationship between stable isotope values (δ15N: a, b; δ13C: c, d and δ18O: e, f) and age in sperm whales sampled in Denmark and NW Spain.
Each individual, identified as A-I according to details shown in Table 1, is represented by a different colour.

