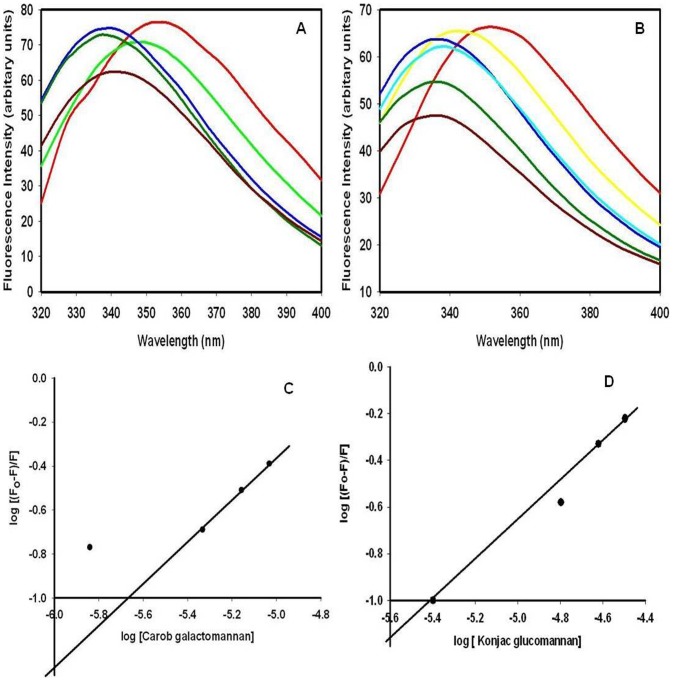
Figure 4. Tryptoptophan fluorescence emission spectrum of CtCBM35 in presence of (A) carob galactomannan (%, w/v), represented in lines: (red) without polysaccharide, (in green) 0.01, (light blue) 0.04, (dark green) 0.06, (dark red) 0.08. (B) konjac glucomannan (red) without polysaccharide, (yellow) 0.01, (deep blue) 0.04, (light blue) 0.06, (dark green) 0.08, (dark red) 0.1.
(C) Hill plot of log [(Fo−F)/F] vs log [carob galactomannan] (D) Hill plot of  vs log [konjac glucomannan] used to derive association constant (K
a).

