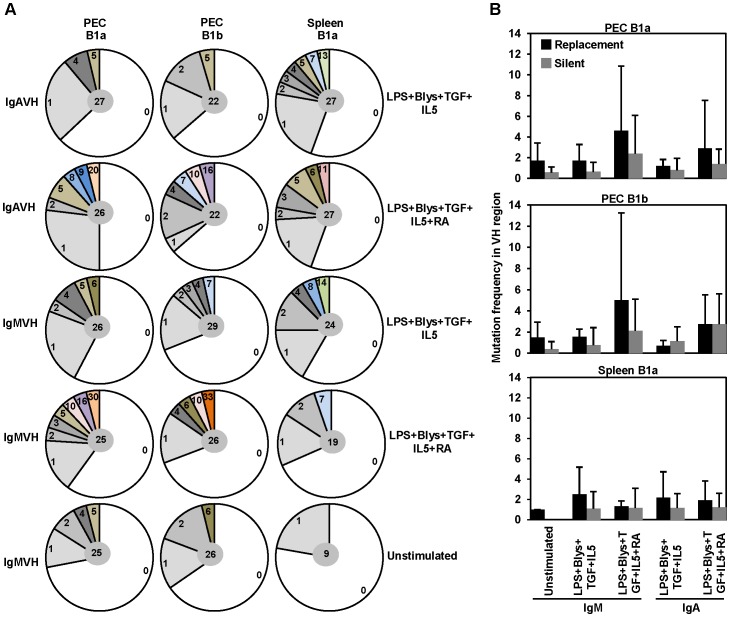
Figure 4. PEC and splenic B1 cell derived IgA VH sequences display high frequencies of nucleotide exchanges due to somatic hypermutation.
Frequency of mutations observed in the IgM or IgA VH region sequences derived from PEC and splenic B1 cells cultured for 4 days with the indicated combinations of IgA CSR inducing factors. (A) Each colored sector represents a particular number of mutations found at a particular frequency. Total number of sequences is shown in the middle. (B) Number of replacement and silent mutations amongst IgM and IgA VH sequences derived from indicated B cell populations. Sequences were analyzed using SEQUENCHER™ Version 4.1 for Macintosh software (Gene Codes Corporation). Assignment of VH chain was done using VBASE2 database (http://www.vbase2.org/). Only functional sequences were included for the mutation analysis. Bars represent mean ± SD.

