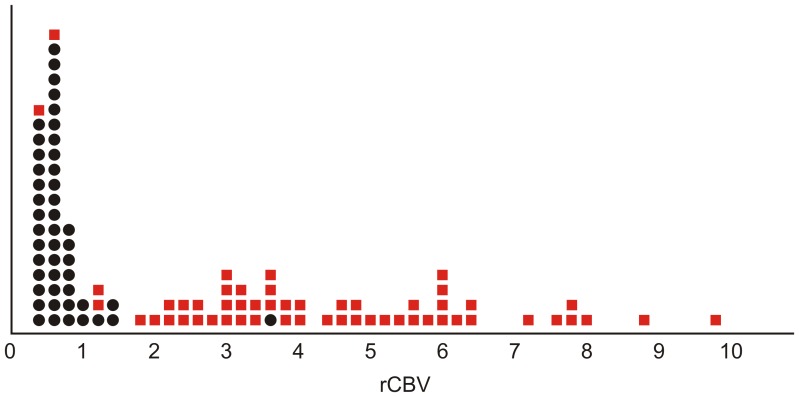
Figure 2. rCBV values (x-axis) obtained for each patient are represented as individual points and classified according to the characteristics of the lesions: neoplastic (red squares) or infectious (black dots).
Note that the points corresponding to infectious lesions are mainly concentrated in the lower values of rCBV, whereas the points for the group of neoplastic lesions are more dispersed and show a trend of higher rCBV values.

