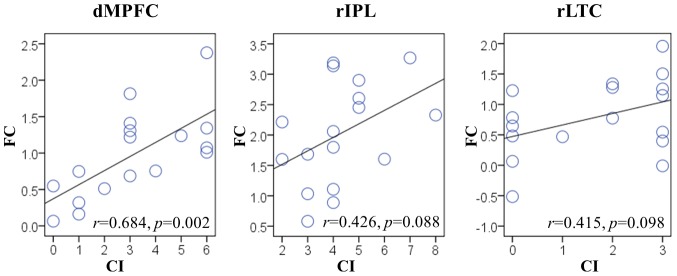
Figure 6. Correlation analysis between two fMRI connectivity attributes in aMCI.

Scatter plots show the significant positive correlation between FC and CI in the dMPFC. (p<0.05), and trending positive correlations between FC and CI in the rIPL and rLTC. (0.05≤p≤0.10). Each circle represents data from a single subject.
