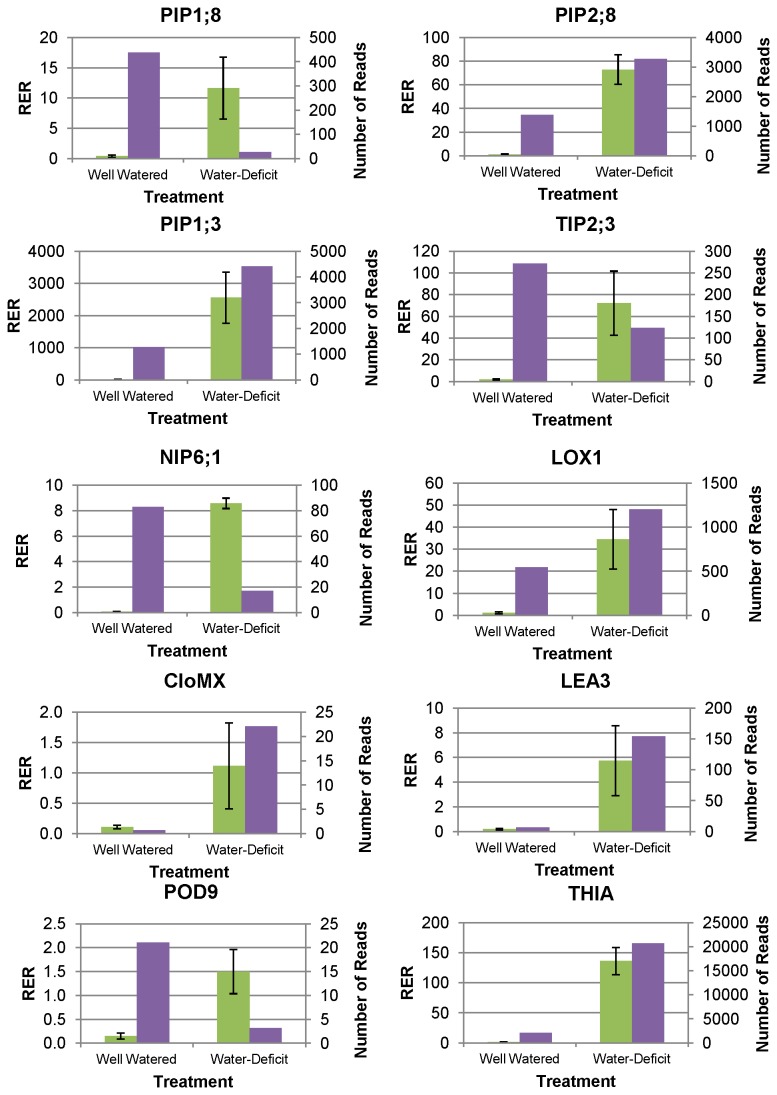
Figure 5. RT-qPCR confirmation of RNA-seq results.
RT-qPCR confirmation (left Y-axis, green bars) and normalized RNA-seq read count values (right Y-axis, purple bars) of differentially expressed genes between well-watered and water-deficit treatments. RT-qPCR was calculated using the ΔCt method [55]. Error bars represent standard error of genotype means.

