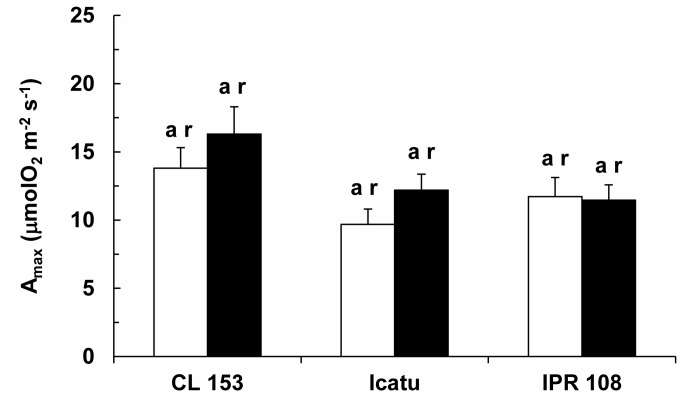
Figure 2. Potential photosynthesis.
Changes in photosynthetic capacity (Amax) in the leaves of C. arabica (Icatu and IPR 108) and C. canephora (Conilon CL 153) grown under 380 (white bar) and 700 (black bar) μL CO2 L-1. The mean values + SE (n = 6) followed by different letters express significant differences between cultivars for the same CO2 treatment (a, b) or between CO2 treatments within the same cultivar (r, s). The ANOVA for Amax showed significant differences between cultivars for the same growth CO2 treatment.

