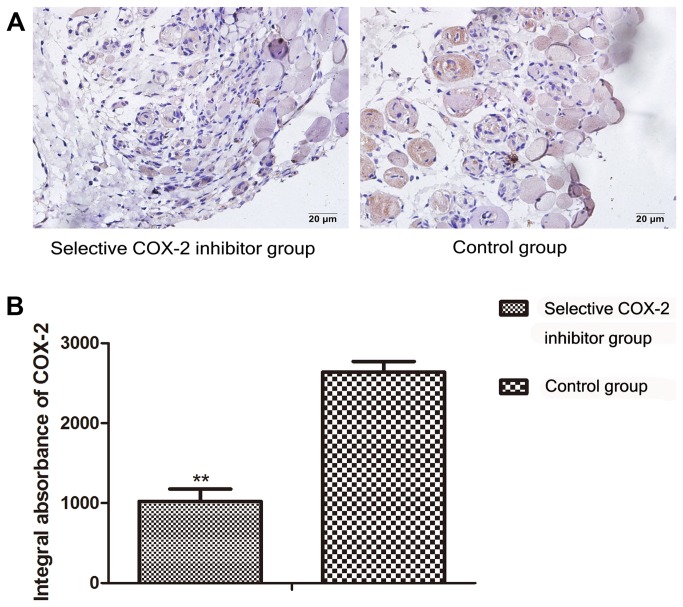
Figure 3. Comparison of COX-2 expression in the intermediate area II between COX-2 inhibitor and control group.
A. To evaluate the expression of COX-2 protein in the intermediate area II in the two groups, sections of the tissues were taken for immunohistochemistry test and observed under original magnification, ×400. B. Integral absorbance (IA) value was detected to compare the level of COX-2. The IA of COX-2 in the selective COX-2 inhibitor group(1022.45±153.1) was lower than control group(2638.05±132.2) (**P<0.01).

