
Figure 1. ROS formation in BEC upon MHR and expression of NOX2 in bEnd.3.
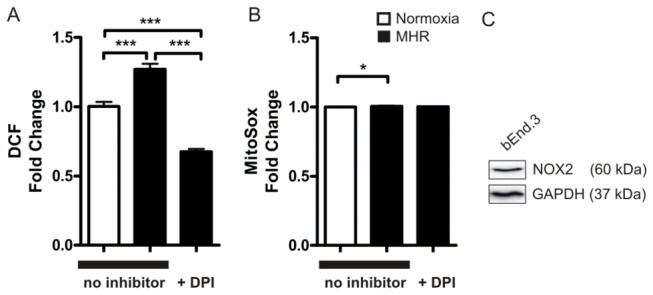
Significantly elevated ROS levels after MHR were detected using the ROS indicator DCF (normoxia 1 + 0.03 vs. MHR no inhibitor 1.27 + 0.04, P < 0.0001, n = 23 - 48 DCF measurements from 3 - 6 experiments). The NADPH oxidase inhibitor DPI significantly blocked the evolution of ROS (MHR no inhibitor 1.27 + 0.04 vs. MHR+DPI 0.67 + 0.02, P < 0.0001, n = 48 DCF measurements from 6 experiments, A). Mitochondrial ROS levels detected by MitoSox were significantly elevated after MHR but to a lesser extent than ROS detected with DCF (normoxia: 1 + 0.002 vs. MHR 1.01 + 0.003, P = 0.0152). DPI did not block ROS significantly compared with MHR conditions without the inhibitor (MHR no inhibitor 1.01 + 0.003 vs. MHR+DPI 1 + 0.003, P > 0.05, n = 96 MitoSOX measurements from 3 experiments, B, note that in MitoSox measurements SEM is very small so asterisk do not visualize in the graph). Western Blot of bEnd.3 lysates confirmed that bEnd.3 express the NOX2 containing NADPH oxidase.