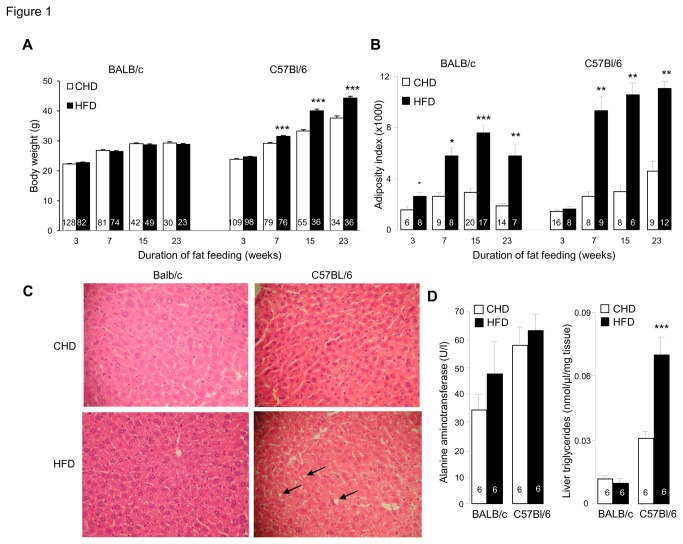
Figure 1. Effects of prolonged high fat diet (HFD) feeding on obesity and fatty liver variables.
Body weight (A), adipose tissue weight (B), liver histopathology (magnification 20X) (C) and liver ALT activity and triglyceride concentration (D) were analysed in C57BL/6J and BALB/c fed HFD or control diet. Data are shown as means±SEM. Number of mice used is shown in the histograms. *p<0.05, **p<0.01, ***p<0.001 significantly different between HFD fed mice and age matched CHD fed controls.

